
Two girls sunbathing at the beach. Leslie Jones, 1934 – 1956. Boston Public Library.
Understanding audiences and evaluating the impact and value of their digital experiences is an essential element in the digital transformation that cultural institutions are going through. The following text is a reflection on the implementation of digital practices centred around the audience and their needs, digital practices that should be informed precisely by an analysis and a study of the audience. Our goal is to apply this methodology to the Lab’s blog in order to make its contents more relevant, to improve the communication strategies and to adjust the format in which contents are presented in accordance to the users’ motivations and interests.
Internet and new technologies can help institutions connect with new audiences and broaden the promotion of content to a virtual audience that goes beyond the people who participate in the activities in person. Contents are increasingly more produced and aimed at a virtual audience through multiple channels and formats: websites, videos, posts, social networks, mailing, apps, in situ interactive devices, etc. In order to efficiently manage efforts and resources, it is important to follow a digital strategy that takes into account both the purposes of the institution and the needs of its objective audience. That entails, on the one hand, being clear about the goals and, on the other hand, understanding what purpose they will serve the user. But before delving into how the CCCB Lab’s goals are connected with the needs of the blog visitors, it would be good to clarify the concept known as “digital engagement”. In the cultural sector, this describes a relation between the institution and the audience it attracts, inspires and connects with. Digital engagement is particularly important when it comes to establishing a digital plan or giving shape to contents. In recent years, many cultural entities have realised that having as many visitors as possible should not be the ultimate goal. Making the aforesaid connection with an audience is just as important.
An audience-oriented strategy entails having the potential audience involved during the different development stages of a project. This guarantees that the final product is accessible and easy to use, that it connects with the audience and offers a more gratifying and meaningful experience. In fact, this approach applies to all kinds of initiatives, although for our purposes we will focus mainly on web projects.
In order to develop a strategy centred around visitors, we need to have in-depth knowledge of them, both quantitatively and qualitatively. The CCCB Lab uses the services offered by Google Analytics to compile anonymous data from Internet hosts and thus have a global perspective about the impact of its online actions: how many people visit the blog, how do they get to it, what articles are the most popular, what devices are used to access the contents, etc. With these data in hand we can observe patterns and assess the blog’s activity.
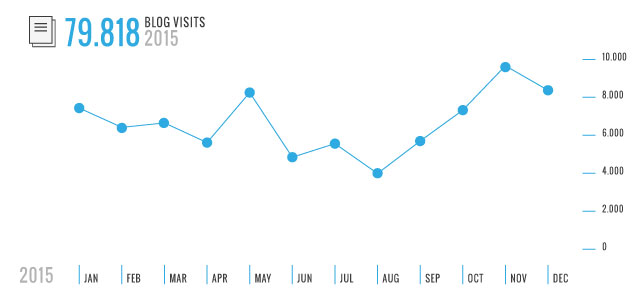
CCCB Lab blog visits during 2015.
Users who do not want Google Analytics to track their digital footprint can avoid it by using tools like Do Not Track or Anonymizer, among other suggestions included in Anonymise Yourself. Electronic Self-Defense Handbook, put together by José Luis Vicente and Gemma Galdón and edited for the Bing Bang Data exhibition.
But what does these data tell us about engagement and the blog? How can we know whether our visitors find what they are looking for and whether they find it interesting? Google Analytics allows us to quantify this interaction, but does not define it. In order to sophisticate our study on virtual audiences, it is especially interesting to carry out a segmentation according to user motivation (what they want to know, obtain…) and online behaviour (searching, discovering, learning, contributing, sharing, etc.). After all, a visitor’s online experience is the synthesis of the motivation and satisfaction of his needs and interests. Often these motivations differ from a virtual to an in-person visit, but in today’s scenario we need to understand the sum of experiences as a whole. In some cases, knowing the motivations of online visitors can help predict the behaviour of visitors at the physical institution as well, as exemplified by users who go online to find practical information about the centre or the activities programmed there.
Measuring and obtaining data to create value is one of the topics that have attracted more attention from cultural institutions in recent years. We can find several online resources and tools that help us better understand public audiences. Let’s Get Real, for instance, is a project launched by the British organisation Culture24 with the idea of studying virtual audiences with data from 20 cultural institutions in the UK. Since 2010, they have been publishing web resources and reports on the different stages of their studies –the second of which, incidentally, deals with digital engagement.
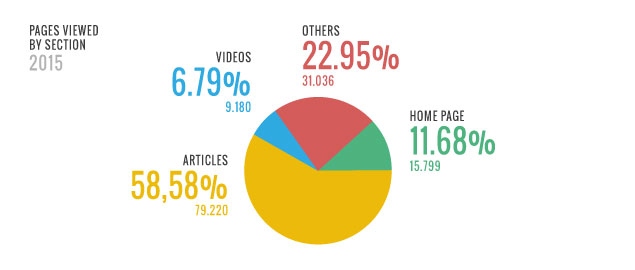
CCCB Lab blog visits during 2015.
Since 2012, the Indianapolis Museum of Art also carries out periodical studies on their visitors’ motivations and how they influence online behaviour. The IMA’s research team suggests an interesting, hybrid methodology that combines data from Google Analytics with brief online surveys from SurveyMonkey. With a single pop-up question, the user is asked about his or her motivations for visiting the website. To track these answers, the IMA team uses the Custom Variables feature in Google Analytics and adds a bit of JavaScript coding. When users select a survey option, JavaScript keeps the answer from being collected in the usual manner. Instead, it uses Google Analytics API to establish a custom variable and link the survey answer to the online session, thus making the analysis more meaningful.
A similar survey was recently active on the MoMA’s website. A window with just one question about the visitor’s motivations popped up when navigating their online collection. It’s interesting to note that multiple-choice answers were not always displayed in the same order and that, once answered, the question didn’t pop up again to the same user.
The Tate has also published numerous studies and resources to analyse digital audiences. Only this year, during the Museums and the Web 2015 conference, they presented a study on the motivations of their web visitors. The study explains how they first analysed the motivations and use of the online collection to establish a segmentation. Afterwards, they were able to notice that, apart from the different motivations, visitors on their website had different levels of art knowledge and therefore varying needs in regards to the content. For that reason, they decided to establish a segmentation that classified web visitors according mainly to motivations but also taking into account a series of variables, among which were art knowledge, professional ties to art, online behaviours and connection with the actual, physical gallery.
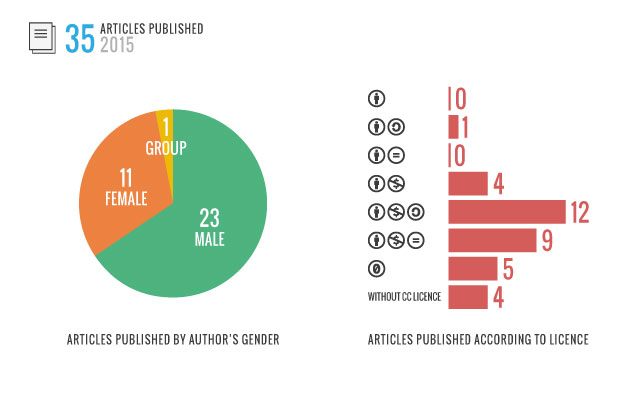
CCCB Lab blog publications during 2015.
There is not a single formula for all studies, it all depends on the goals set for each project. However, what does constitute a key element in establishing an evaluation culture for an organisation is the transparency of results. There are many ways of communicating results and making data accessible to other institutional partners and to the general public (always in accordance to the data protection laws that apply). Presenting some results during meeting, for instance, publishing reports and infographics, or creating dashboards that display constantly updated results and help monitor trends. Automatising reports and establishing a standard data presentation format with dashboards can save a lot of time during the analysis, and therefore during the decision-making as well. The Indianapolis Museum of Art was pioneer in publishing a dashboard in 2007, for which they also released the open code to support and encourage institutional transparency in museums. Other cultural institutions use dashboards as well and have them available online, such as the Dallas Museum of Art, the Warhol Museum, the Cleveland Museum of Art and the Museum of East Anglican Life, among others. The Metropolitan Museum of Art has also recently published an article on the implementation of dashboards for digital analysis.
As far as Catalan institutions go, the entry into force of the Transparency, Access to Public Information and Good Governance law (DOGC number 6780, 31/12/2014) will surely improve policies in that domain. This past June, Through the Looking Glass was published, a report that re-examines and evaluates the transparency of 60 art museums in Spain and shows that there is still a long way to go. The MNAC published a series of thoughts on their blog and rightly pointed out the importance of establishing qualitative indicators to rate transparency.
This evaluation culture is instructive, but we should bear in mind that it needs to be integrated within a larger-scope project. In other words, gathering data cannot become an end in itself or an obsession that winds up limiting our projects. Instead, it needs to inform our decision-making as a collective and open learning process.
References
Filippini Fantoni, S. and R. Stein (2012) “Exploring the Relationship between Visitor Motivation and Engagement in Online Museum Audiences”.
Finnis, J., S. Chan, and R. Clements. (2011) “Let’s Get Real: How to Evaluate Online Success?” WeAreCulture24 | Action Research.
Villaespesa, E. and J. Stack (2015) “Finding the motivation behind a click: definition and implementation of a website audience segmentation”.
Milligan, D. and M. Wadman (2015) “From Physical to Digital, Recent Research into the Discovery, Analysis, and Use of Museums Resources by Teachers and Students”.
MacDonald, C. (2015) “Assessing the User Experience (UX) of Online Museum Collections: Perspectives from Design and Museum Professionals”.
At the Lab, we analyse our blog to assess its contents, format and designs. We wish to keep working in that direction and find active ways to receive your feedback, so that we can understand better your needs as visitors and what you expect to find at the Lab’s blog, which will help us improve. For this first stage of our study we have put together a brief survey, which you can find on our blog and which we encourage you to take. Your answers will be kept confidentially and will only be used by the CCCB Lab to improve its blog contents. We know a good relationship is based on trust and transparency. That’s why we will publish and share our thoughts on the study and the proposals that result from it.


Leave a comment